
Bitcoin: Understanding the 4-year cycle
How to Strategically Position Yourself for the Predictable Market Cycles


Chart Pilgrim is now on X! Follow for daily crypto & news updates.
"History doesn't repeat itself, but it does rhyme." — Mark Twain
Bitcoin and the broader crypto industry follow a predictable four-year cycle that is crucial to understand for profitable navigation. This cycle has remained remarkably consistent, and the key to success is straightforward: buy during the bear market when activity is low, and sell during the mania phase when retail investors flood in. However, simplicity does not equate to ease. This article aims to bridge that gap by equipping you with the insights needed to confidently execute trades in the next bear market.
Anatomy of a market cycle

Before diving into the four-year crypto cycle, it's essential to first understand market cycles in general. They begin with smart money investing early when no one is paying attention. As momentum builds, institutional investors follow, and eventually, the public piles in during the euphoric mania phase. The key takeaway is simple: the best times to invest are during the stealth and awareness phases. The goal is to enter early and go in hard—because by the time the media is covering the market’s moves, the real opportunity is gone.
During the mania and blow-off phases, prices skyrocket as emotional retail investors rush in, chasing quick profits. FOMO takes hold, and suddenly, everyone—from coworkers to taxi drivers—is buying. This is when institutional investors use retail investors as exit liquidity, selling off their holdings and locking in profits while latecomers are left holding the bags. In essence, market cycles serve as a wealth transfer mechanism, moving capital from uninformed investors to those who had the patience and foresight to buy during the quiet, boring bear market.
"The stock market is a device for transferring money from the impatient to the patient." — Warren Buffet
"What the wise man does in the beginning, the fool does in the end." — Howard Marks, Mastering The Market Cycle
Bitcoin cycles
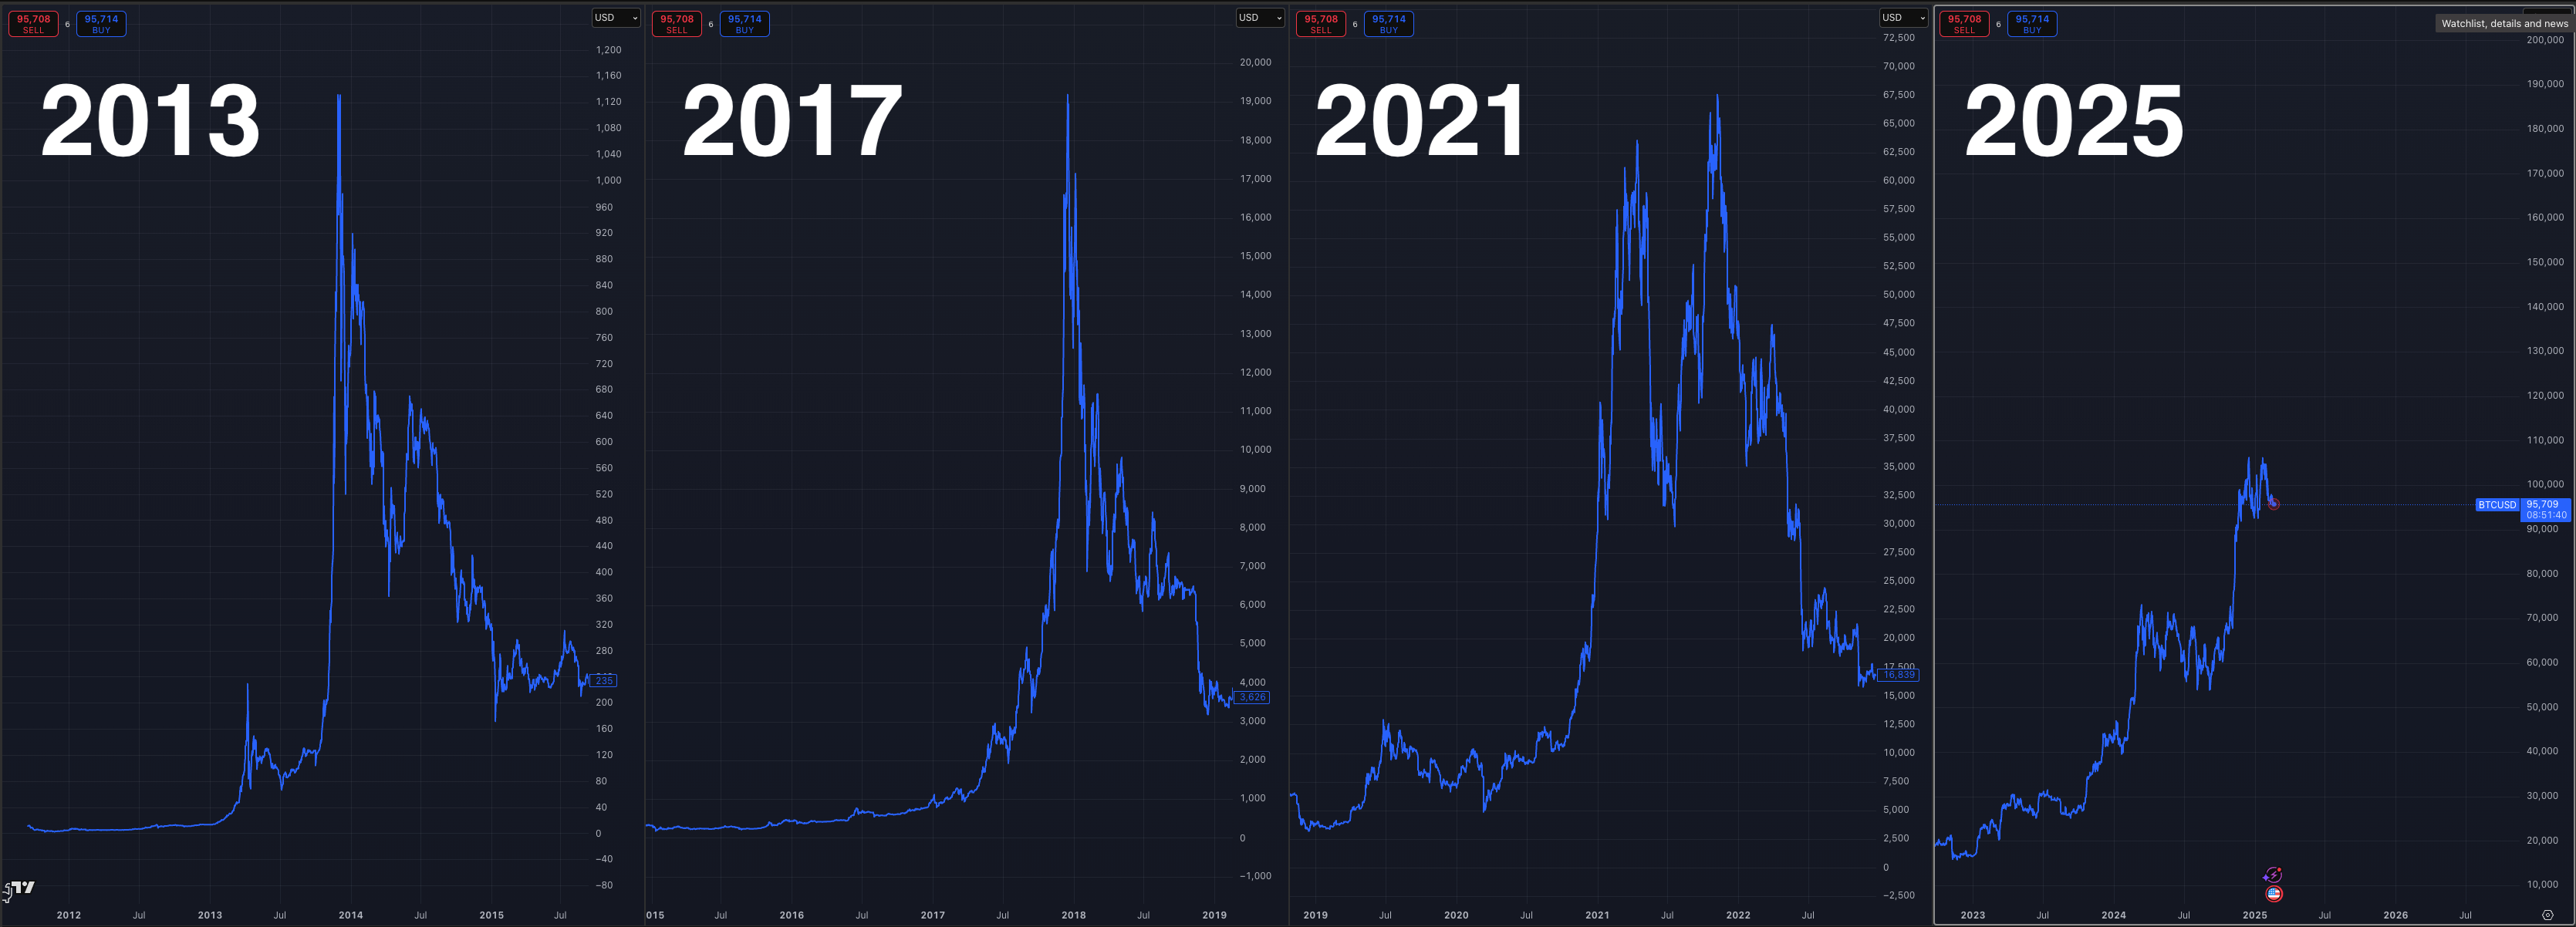
Bitcoin serves as the barometer for the broader crypto industry, with market cycles typically revolving around this asset. Historically, we’ve seen four major cycles, each spaced almost exactly four years apart. While there are minor variations, the overall structure remains consistent.
Why does this happen?
Why is the Four-Year Cycle So Predictable and Repeatable?
The answer lies in two key factors:
1. Global liquidity cycles
Bitcoin’s four-year cycle closely follows global liquidity patterns, particularly those tied to the U.S. election cycle. In the lead-up to elections, the U.S. government frequently engages in quantitative easing—expanding the money supply (M2) to stimulate economic growth and, indirectly, bolster voter confidence.

The chart above illustrates Bitcoin’s price alongside the amount of money printed (green line) by each sitting U.S. president during their four-year tenure since 2013.
A closer look at the cumulative change in U.S. Dollar Money Supply (M2) across presidential terms reveals a consistent pattern: regardless of political party, money supply continues to expand. This trend persisted into Biden’s term until inflationary pressures in 2022 triggered a temporary slowdown. However, since 2024, money supply growth has resumed its usual trajectory.
The key takeaway: in the lead-up to and following every US election, money is printed to stimulate economic sentiment and, by extension, voter confidence. Whether through stimulus checks or other mechanisms, this newly created liquidity flows into risk assets like Bitcoin, driving prices higher.
Even with the Fed’s current hawkish stance in 2025, the rising burden of U.S. interest payments makes future money printing almost inevitable. As higher interest rates increase debt servicing costs, the US government may have no choice but to inject liquidity to manage growing fiscal pressure. And when the money spigot turns back on, Bitcoin rallies—following its well-established four-year cycle in sync with presidential terms.
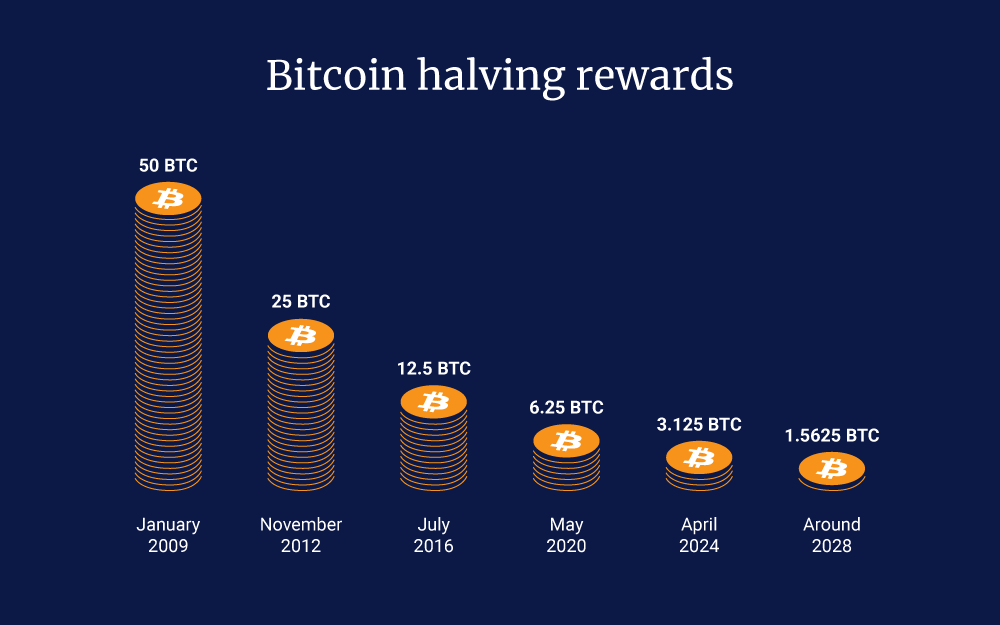
2. The bitcoin halving
The creator of bitcoin, fully aware of the four-year presidential cycle, designed Bitcoin’s monetary system to align with it: every four years, the amount of Bitcoin released per day is cut in half, coinciding with the election year.
This event, known as the halving, serves as a recurring reminder to traders that Bitcoin is becoming increasingly scarce. The predictable reduction in supply, combined with growing demand, creates a scarcity-driven price surge. Markets anticipate this tightening effect well in advance, leading to price appreciation post-halving as investors position themselves accordingly.
Acting on the cycle
Now that you understand the cycle—and how money printing and scarcity drive Bitcoin’s continually rising prices—the next logical question is: how do you take advantage of it?
How can you confidently time the market to enter and exit at the most opportune moments? Let’s break it down:

Behold the Hodler’s Cheat Sheet by The Rational Root—one of the most insightful visualizations of Bitcoin’s price movement over time.
In this chart, time is represented in a circular, clockwise format, with price radiating outward—the center represents $0, while the outer edge nears $1M. The chart spans four years, aligning with Bitcoin’s halving cycle, meaning each quadrant represents one year. For example, 12 o’clock corresponds to January 2025, 3 o’clock to January 2026, and 6 o’clock to January 2027—you get the idea.
Spotting market cycle tops and bottoms
Focus on 3 o’clock, where you’ll find three green dots—these represent previous cycle tops. The pattern is unmistakable: Bitcoin’s market peaks have historically occurred in November–December, a trend that has held true for the past 12 years (with cycle tops in 2021, 2017, and 2013).
Now, shift your attention to 6 o’clock, where you’ll see red dots marking cycle bottoms. These consistently occur one year after each market peak, offering a clear historical window for optimal accumulation. If this trends hold, January 2027 would mark the ideal time to re-accumulate Bitcoin in preparation for the next bull market.
At the outer edge of the circle, you’ll notice the standard market cycle stages, mirroring the first cycle chart discussed earlier in this article. When viewed through this lens, the four-year cycle’s consistency becomes undeniable. Most people miss this pattern because they focus on short-term price movements. But once you zoom out, the repetition of Bitcoin’s market cycles—and its astonishing predictability—becomes crystal clear.
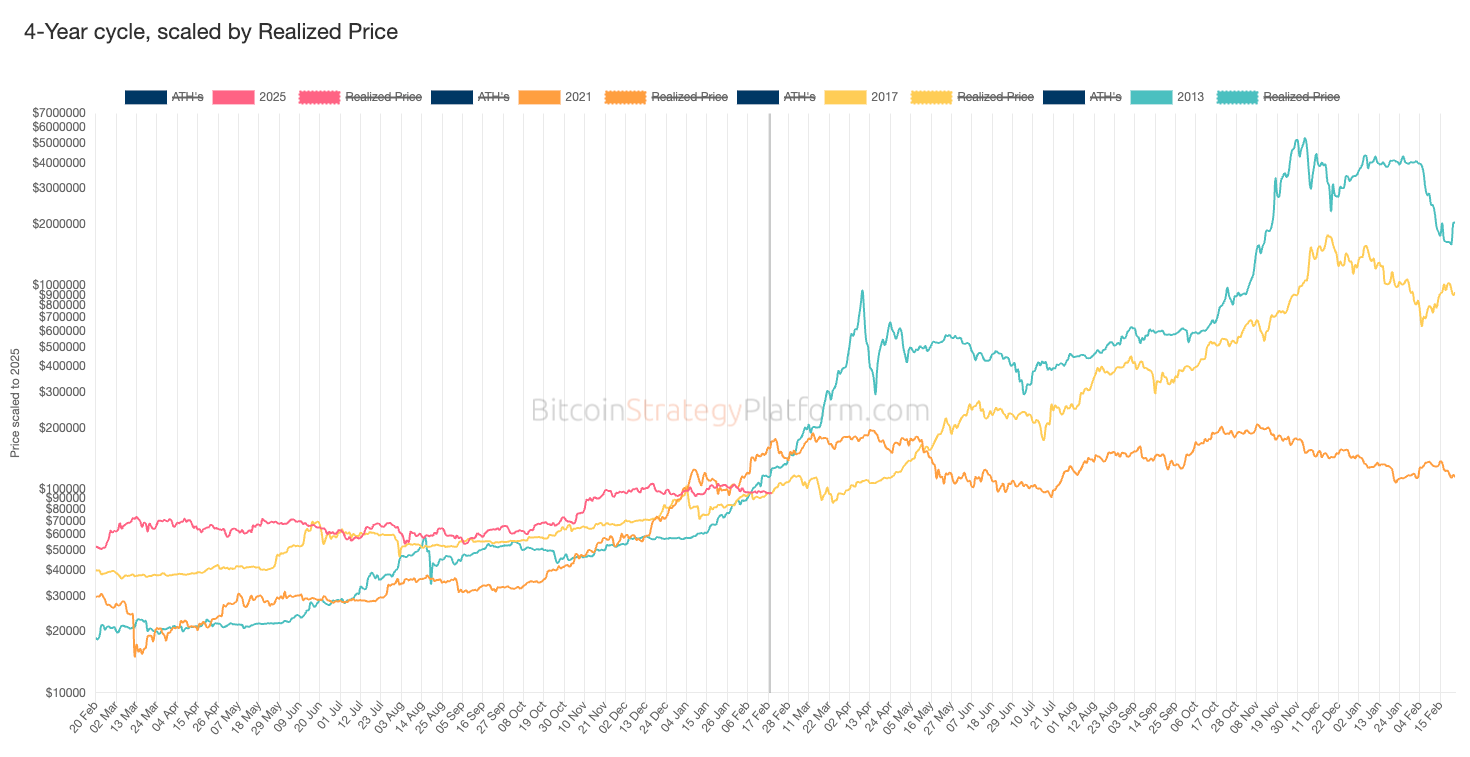
Let’s visualize this another way. Imagine taking the circular chart, unrolling it, and stacking each four-year cycle on top of one another. When we overlay past cycles (2025, 2021, 2017, 2013), the pattern remains remarkably consistent.
Looking at the pink line (2025), you’ll notice that we are currently only halfway through this bull cycle. If history repeats itself (a big if, but one worth considering), we could expect the cycle peak in November–December 2025—right in line with previous market tops.
Diminishing returns

One important factor to keep in mind is that as each cycle progresses, Bitcoin’s price climbs higher—but diminishing returns become inevitable.
The chart above, displayed on a logarithmic scale, highlights this trend: as Bitcoin matures, it becomes increasingly difficult to sustain the same exponential price growth seen in earlier cycles. Some investors overlook the fact that Bitcoin is now a trillion-dollar asset, making another 10x surge far less likely than in its early years.
As more market participants recognize and act on the four-year cycle, markets will become more efficient, reducing the opportunities to profit from it. Over time, Bitcoin’s price is expected to stabilize, with diminishing volatility in its later years. The chart already reflects this shift, showing a gradual loss of extreme price swings as Bitcoin moves toward maturity.
Conclusion
Bitcoin’s four-year cycle provides a clear edge for those who take the time to study it. The patterns are there, visible to anyone willing to look. The real challenge isn’t identifying them—it’s having the discipline to act. Avoid FOMO, plan your entries and exits, and remember: the market rewards patience and punishes emotional decisions.
The four-year cycle has been a powerful and reliable framework for over a decade, consistently shaping Bitcoin’s price movements. By understanding its key drivers—global liquidity trends, the halving’s supply shock, and predictable investor behavior—you can navigate the market with greater confidence and sidestep common pitfalls.
Historical data shows a clear pattern: Bitcoin undergoes sharp rallies followed by deep corrections, creating well-defined opportunities for accumulation and profit-taking. While no cycle will repeat exactly, the rhythms of past cycles provide valuable insights. The key to mastering this cycle isn’t just spotting the phases—it’s staying disciplined, positioning yourself early, and acting ahead of the crowd.
Disclaimer: The content on this Substack is for informational and educational purposes only and should not be considered financial advice. Nothing here constitutes investment recommendations, and you should always conduct your own research or consult a professional before making financial decisions.